Ever wondered who else read HackerNews? You might have made friendships, found new business partners or got great amounts of traffic from HackerNews. I was interested in what the average HackerNews reader runs on their computer, where they are living and how engaged they are when a HackerNews reader clicks on a link. To satisfy my interest, I pulled the numbers for Slashdot and did some analysis… Here it goes:
Since August 1st, in the last 6 months, more than 115,000 people came to visit Slashdot from HackerNews. Several stories featured and discussed on Slashdot made the homepage of HackerNews, of which the top 3 were:
1. Rob ‘Cmdr Taco’ Malda resigns from Slashdot (13,828 pageviews) (HN link)
2. Canonical drops CouchDB from Ubuntu One (5,185 pageviews) (HN link)
3. Sopa creator in tv/film/music industry pocket (4,839 pageviews) (HN link)
With 115,000 visits, I believe I have a big enough sample to analyze the HN users to find some commonalities and to profile the tech set up of their computers. For the analysis I used the Google Analytics data from Slashdot. For simplicity sake, I created an Advanced segment, which will generate all reports in fast-mode. This means the reports are based on Sampled data in GA! Learn more about fast mode in GA at the Google Support pages.
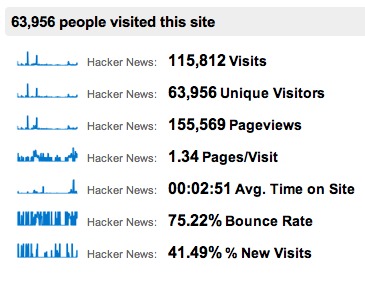 First, let’s breakdown the traffic, these 115K visits, a little further.
- 115,812 Visits
- 63,956 Unique Visitors
- 155,569 Pageviews
- 1.34 page/visit
- 2.51 Ave time on site
- 75.22% bounce rate
- 41.49% New visits
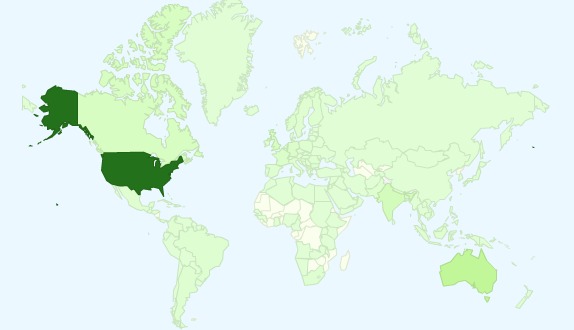
Where are HN users from?
Off course it would be interesting to see where these 115K HackerNews readers are living. In Google Analytics the location report is a great tool to see where your website visitors are coming from.
Which countries do these HackerNews visitors coming from?
The majority of HN visits to Slashdot came from people located in the USA. There is a large gap between the US and the #2.
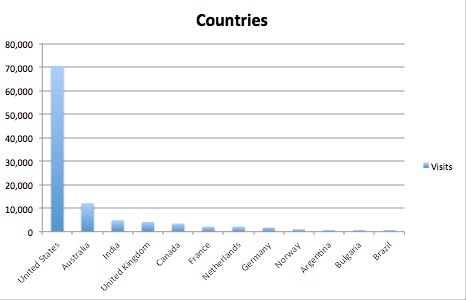 The top countries with the visits are:
- United States 70,524 visits
- Australia 10,099 visits
- India 4,839 visits
- United Kingdom 4,148 visits
- Canada 3,457 visits
- France 2,074 visits
- Netherlands 2,074 visits
- Germany 1,728 visits
- Norway 1,037 visits
- Argentina 691 visits
Which Cities do these HackerNews readers call home?
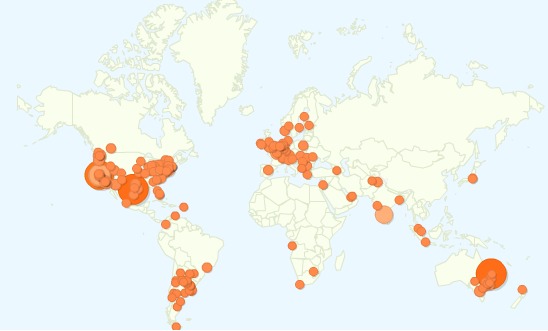
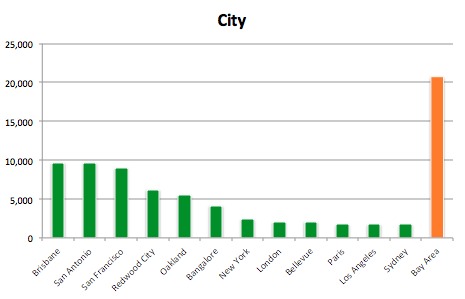 Brisbane 9,679 visits
- San Antonio 9,679 visits
- San Francisco 8,988 visits
- Redwood City 6,222 visits
- Oakland 5,531 visits
- Bangalore 4,148 visits
- New York 2,419 visits
- London 2,074 visits
- Bellevue 2,074 visits
- Paris 1,728 visits
What browser is the favorite for HN users?
It has become clear from the visitor numbers I’ve analyzed, HackerNews readers use Internet Explorer very limited. The browser of choice for the HN visitor is Chrome. It’s impressive how Chrome is seeing high growth in market share in the browser wars, especially in tech savvy communities. For Slashdot’s HackerNews visits, the browser shares were dominated by Chrome to an extend I didn’t expected.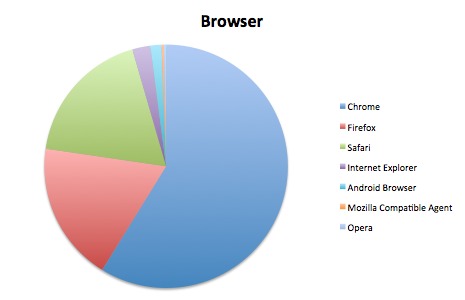
- Chrome 67,104 visits
- Firefox 21,434 visits
- Safari 21,088 visits
- Internet Explorer 2,765 visits
- Android Browser 1,728 visits
- Mozilla Compatible Agent 345 visits
- Opera 345 visits
What Operating System is the choice for HN users?
The operating system of choice for the HackerNews visitor is not a landslide victory for Apple Mac OS, but there is a large gap before Windows appears on the #2. Linux takes a respectable third place, after which the mobile OS’ are coming in on #4,5 and 6. 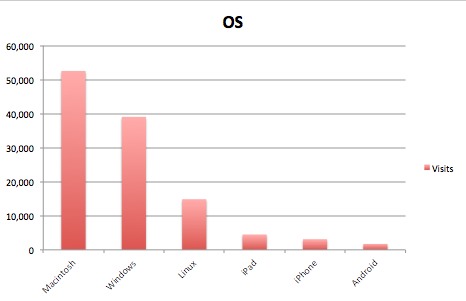
- Macintosh
- Windows
- Linux
- iPad
- iPhone
- Android
It would be interesting to see how the mobile operating systems take a larger share over time.
Of the Window users 84% is on Windows 7, while only 2% of HackerNews visitors rocking it on Windows Vista. Thirteen percent is still on Windows XP. Just 1% of Windows users are on Server 2003.
Screen resolution of the HN user?
And last, I wanted to see what kind of large screens HackerNews readers are using. The larger the screen resolution might indicate a very large screen!
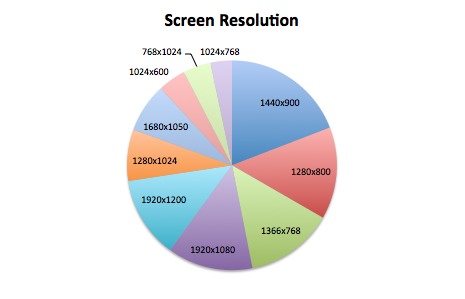 1440×900 20,051
- 1280×800 14,865
- 1366×768 14,174
- 1920×1080 13,828
- 1920×1200 13,136
- 1280×1024 8,297
- 1680×1050 7,951
- 1024×600 4,494
- 768×1024 4,494
- 1024×768 3,457
Engagement of the HackerNews visitors
As the image at the top shows, the Average HackerNews visitor to Slashdot was not very engaged. With a bounce rate of ~75%, and 1.4 pages per visit and an average of 2.4 minutes on the site. These engagement numbers are considerable lower than the average Slashdot visitor.
Conclusion
On my Chrome browser, I have HackerNews set as the homepage. Every time I start my browser I can read instantly what is happening in the technology industry. HackerNews can bring any website a large amount of traffic, but you should always pay attention to what kind of traffic you need to be successful. If you are running a media company, and get paid based on CPM’s, HackerNews can be a great source of traffic.
Let me know if you would like to see these kind of analysis more often on different referrals.
Data: The data showcased in this post has been derived from the Slashdot Google Analytics for the period of August 1st – December 20th.
Disclaimer: The data presented in this analysis has been derived from Google Analytics on Slashdot. It represents a small subset of the total. The comments included herein are my own and don’t necessarily represent Geeknet’s opinions
Leave a Reply